Cancer Genetic Interaction database 2.0
What is CGIdb2.0?
What data types are included in the CGIdb2.0?
CGIdb2.0 catalogs SL and SV gene pairs across more than twenty cancer types. Additionally, CGIdb2.0 collects quantitative chemical-genetic interaction pairs and enhances the interpretation of GIs mechanisms using within-protein complex or pathway model and between-protein complex or pathway model. CGIdb2.0 also tests correlation of GIs gene pairs that influenced the drug effect based on multi-omics data sourced from TCGA.
How do I cite the CGIdb2.0?
Kindly acknowledge the following portal papers in your citation:
Title: “Harnessing genetic interactions for prediction of immune checkpoint inhibitors response signatures in cancer cells.”
Additionally, please ensure to attribute the source of the data, especially if derived from publicly available datasets.
What are the features of the CGIdb 2.0?
The key features of CGIdb 2.0 are conveniently listed in the left-hand menu. Navigate through various options by clicking on them to access specific pages of interest.

HOME
The homepage offers a concise introduction to CGIdb 2.0, featuring a user-friendly 'Statistical Humanoid Chart' for easy visualization.
Additionally, you can find links to external public databases utilized in CGIdb 2.0 conveniently located at the bottom of the page.
SEARCH
The search page provides a user-friendly interface for searching and browsing GI information for genes of interest.
DOWNLOAD
The DOWNLOAD page is categorized into four sections: Tissue, Source, Drug and Complex/Pathway.
Each category provides the number of genetic interactions related to specific tissues, sources, drugs, and complex/pathway information.
FAQ
The FAQ page serves as your comprehensive guide to navigating and utilizing CGIdb 2.0.
CONTACT US
You can reach out to us by sending an email to guyunyan@ems.hrbmu.edu.cn.
How do I use CGIdb2.0 to get the information I want?
On the Search page, you can initiate your search behaviour (A). CGIdb2.0 enables you to search for SL/SV interactions by gene Entrez ID and gene symbol (B). Additionally, you can explore genetic interactions information based on GI types, immune checkpoint genes or tissue types (C).

What are the features of the searching result interface?
The result interface is divided into two main areas:
- Function panel (A)
- Display platform (B)
You can navigate and utilize the features efficiently using the function panel (A) and explore detailed information through the display platform (B).

The function panel provides following function buttons.

What is the button for?
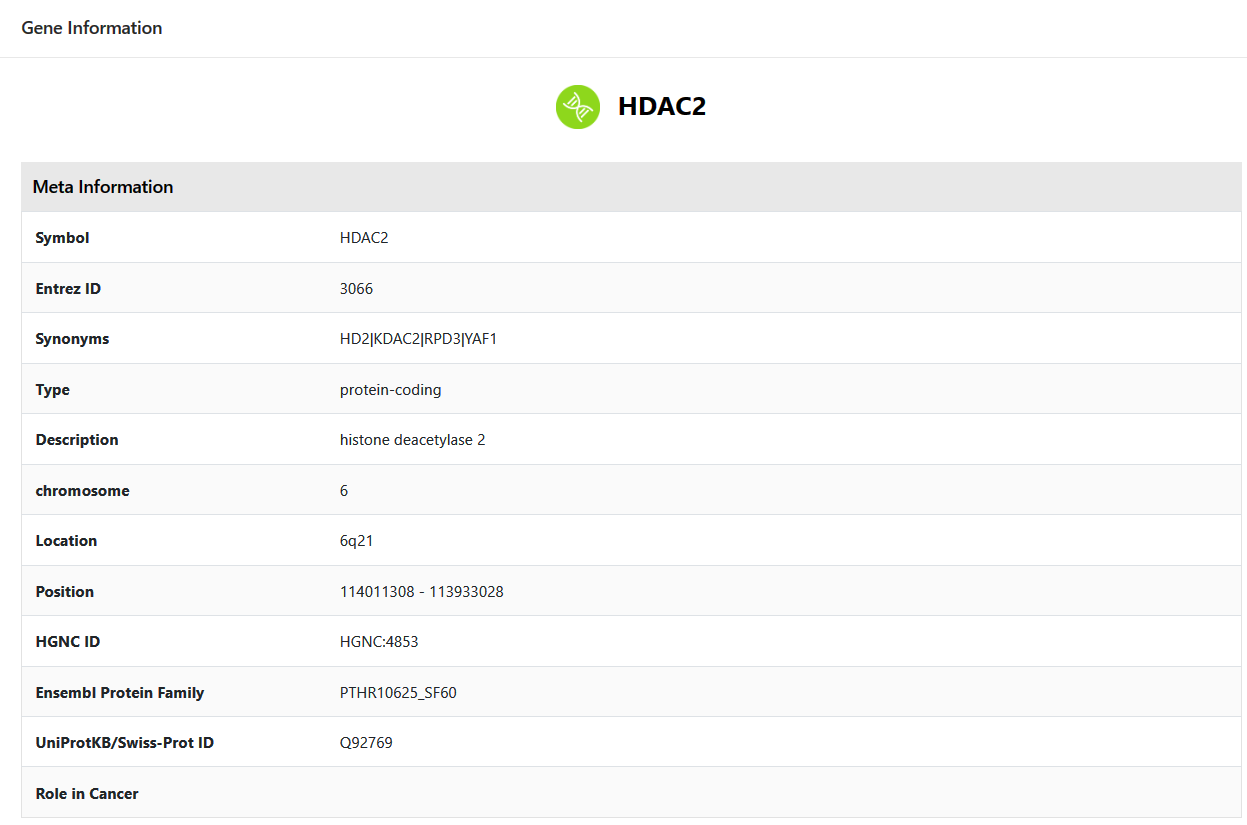
Press to link the result function panel. The basic information of the gene you are searching for will be listed in the following table.

What is the button for?
Press to access the result function panel. The SL/SV interaction network is displayed on the right, and you can hide it by pressing again.


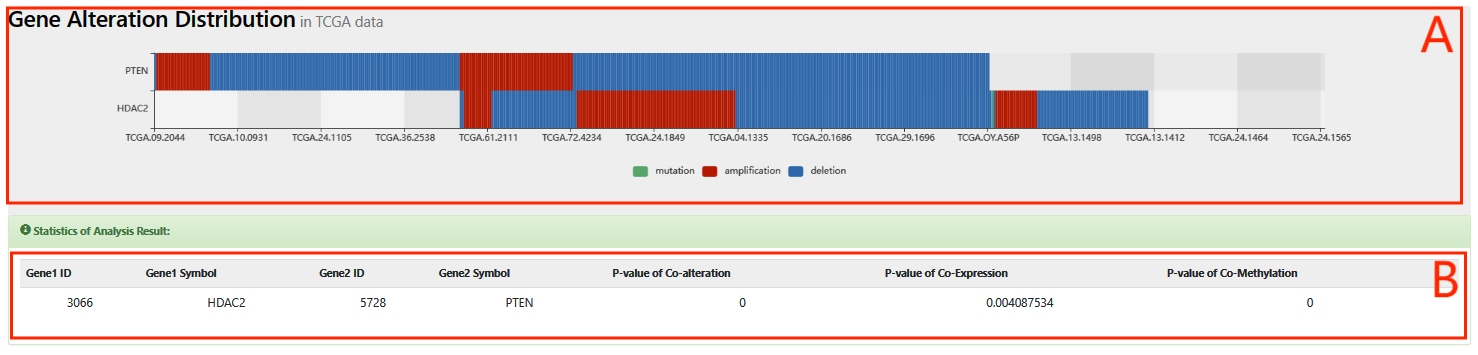
You can choose the cancer type of interest from the node list, and the information is displayed as follows:
The top panel (A) illustrates the distribution of gene alterations in samples from the TCGA cohorts. The colors represent different alteration types: green for mutation, red for amplification, and blue for deletion.
The bottom panel (B) displays the result of statistical tests for co-alteration, co-expression, and co-methylation between two genes for SL or SV interactions.

What is the button for?
Press to link to the function panel, where you can access detailed information for each pair of genetic interactions. This includes gene symbols, tissue types, confidence scores, source, and drug effects. The 'Confidence Score' reflects the reliability of the genetic interaction, and 'Source' indicates the origin of the genetic interaction.
Press to access the drug response test boxplot.


What is the button for?
Press to link the result to the function panel. The table below displays the interactions between the gene you are searching for and chemical compounds, with the 'score' indicating the strength of the interaction effect.

What is the button for?
Press in the result function panel. The interactions between the gene you are searching for and others will be listed in the table below. The table also indicates the type of relationship ('within' or 'between') between the two complexes to which the gene pair belongs.

What is the button for?
Press in the result function panel. The interactions between the gene you are searching for and others will be listed in the table below. The table also indicates the relationship type ('within' or 'between') between the two pathways to which the gene pair belongs.

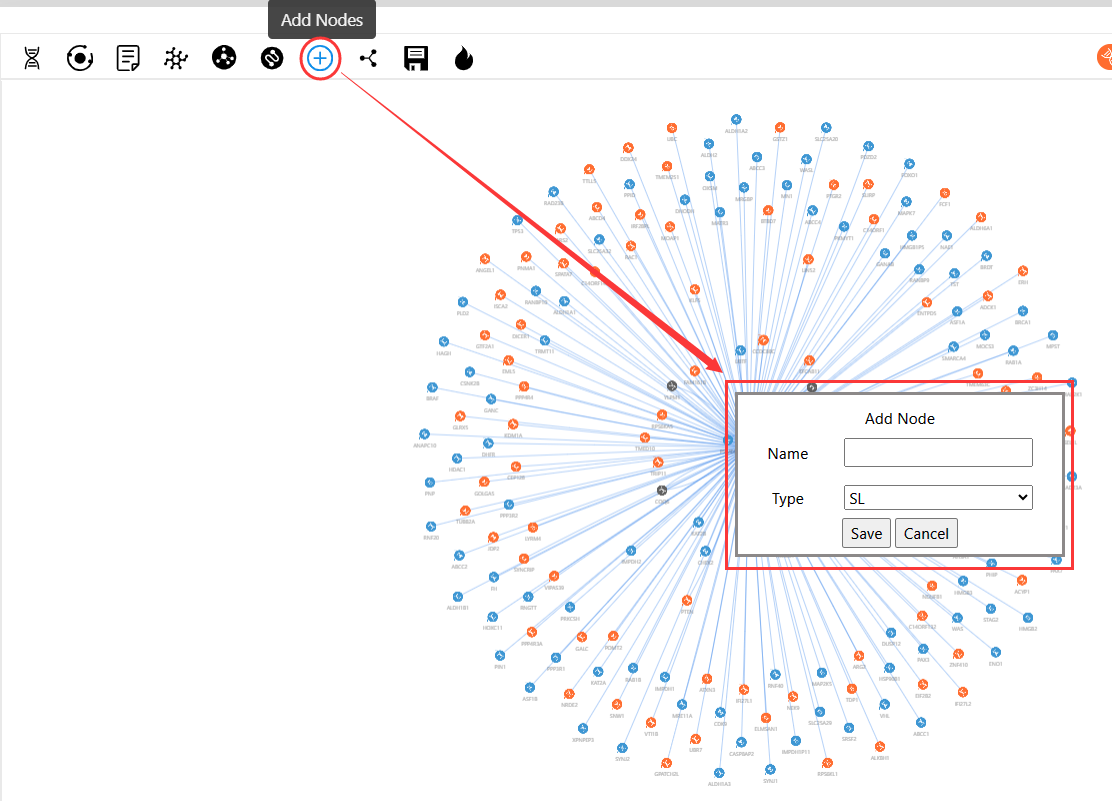
What is the button for?
Press and the network will pop up. You can add your own nodes to the original network diagram, name them, and select the interaction types ('SL', 'SV', or 'No Types').
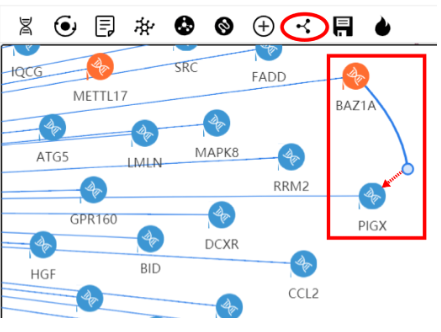
What is the button for?
Press and you can left-click and drag from one node to another to add an edge between them.
What is the button for?
Press and you can save the network on the bottom canvas as .PNG file.

What is the button for?
Press and you will see the word cloud, where the size of the gene symbol corresponds to the frequency of the gene.

How should I interpret the score?
The SV and SL interactions in CGIdb2.0 were obtained from different types of sources, including biochemical assays, text mining results. In addition, biochemical assays were based on different experimental technologies and platforms, such as shRNA, CRISPR and drug inhibition. Because multiple types of evidence are conducive to the identification of SV (SL) interactions, an integrative confidence score combining scores from these evidence sources can provide an overall estimation of the reliability of SV (SL) interaction. In principle, we supposed that (i) the contribution of experimental evidence to the confidence score is more significant than the text mining and that (ii) the SV (SL) interactions supported by more evidence sources should be beneficial to the confidence score. The scoring procedures were divided into two steps, i.e., quantification and integration. A large number of SV (SL) interactions collected from other studies had only qualitative annotation evidence (such as “high-throughput” or “low-throughput”), or technological descriptions of wet-lab experiments (such as “CRISPR screening” or “shRNA screening”). Thus, it was necessary to assign quantitative scores to the SV (SL) interactions before the calculation of integrative scores. Similar to the scoring scheme from SLDB (http://histone.sce.ntu.edu.sg/SynLethDB/), the quantitative scores were assigned based on the experimental methods as shown in the following Table 1. For instance, “Mutant & Mutant” indicated that two genes in SV (SL) interactions were disturbed by transgenic or genetic deletions. Moreover, “RNA interference & Mutant” indicated that one gene was perturbed by RNAi and that the other was perturbed via mutation. In summary, the SV (SL) interactions obtained from low-throughput experiments were considered to be more reliable than the results from high-throughput experiments due to the lower false positive rate. And, a higher confidence score was assigned to low-throughput evidence than high-throughput evidence. Compared to other RNA interference experiments (such as shRNA, siRNA and dsRNA), the CRISPR/Cas9 screen had lower off-target effects, which were assigned higher confidence scores similar to mutation and transfection experiments.
The formula to combine the individual scores as follows:

where S represents the integrative score corresponding to the experimental evidence; Pi is the individual score; and n is the total number of experimental supporting evidence
| Method | Score |
|---|---|
| Mutant & Mutant | 0.9 |
| CRISPR | 0.9 |
| Low-throughput | 0.8 |
| RNA interference & Mutant | 0.75 |
| Bi-specifie RNA interference | 0.5 |
| RNA interference & Drug inhibition | 0.5 |
| High-throughput | 0.5 |
How do I interpret the DOWNLOAD page?
At the top of the page is a summary of the data cohort.
The details of the cohort is showed by table (left) and pie chart (right).
And you can press to download all datasets which CGIdb 2.0 contains (A).

Which studies are included in CGIdb 2.0?
Detailed information on datasets involving samples treated with immune checkpoint inhibitors.
| Datasets | Number of samples | Cancer | ICI type |
|---|---|---|---|
| Lozano2022 | 53 | Melanoma | anti-PD1/anti-PD1+CTLA4 inhibitor |
| YeonKim2020 | 27 | NSCLC | anti-PD-1/anti-PD-L1inhibitor |
| Lee2021 | 22 | NSCLC | immune checkpoint inhibitor |
| Gide2019 | 91 | Melanoma | anti-PD1/anti-PDL1+anti-CTLA4 inhibitor |
| Liu2019 | 121 | Melanoma | anti-PD1 inhibitor |
| Riaz2017 | 62 | Melanoma | anti-PD1 inhibitor |
| Lauss2017 | 25 | Melanoma | anti-IL-2/anti-CTLA4 inhibitor |
| VanAllen2015 | 40 | Melanoma | anti-CTLA4 inhibitor |
| Snyder2014 | 21 | Melanoma | anti-CTLA4 inhibitor |