About
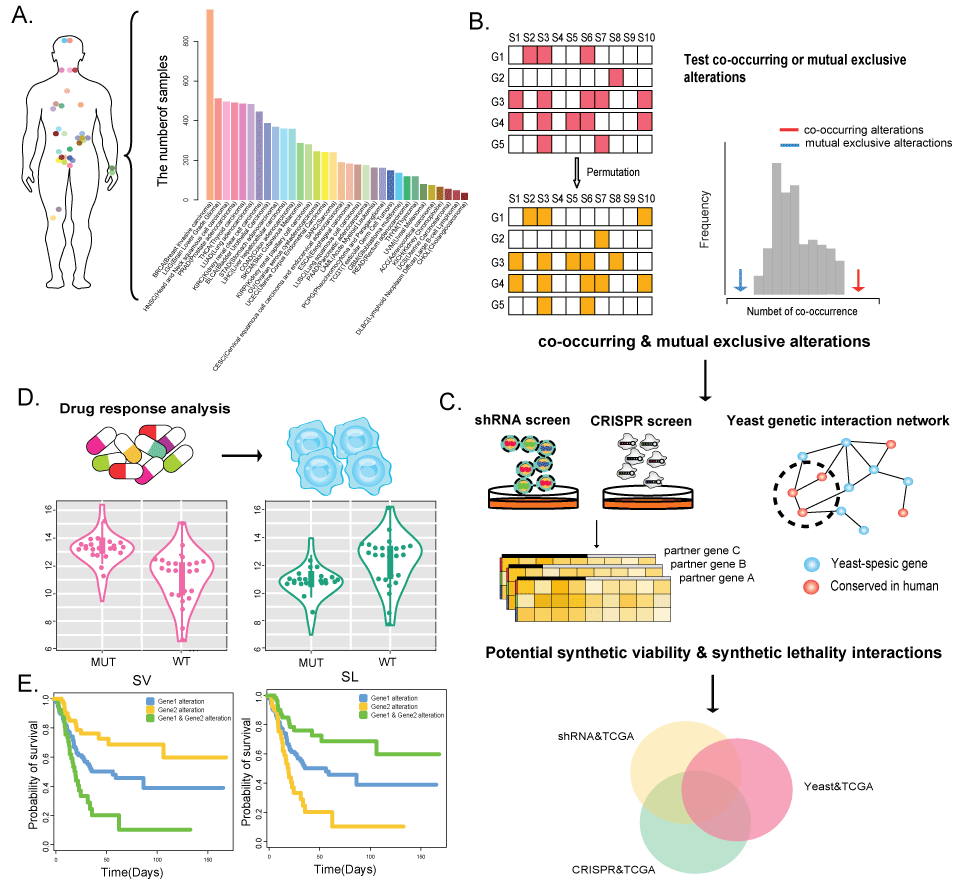
(1) Mutation, copy number alterations and expression profiles are derived across 32 cancer types from TCGA consortium, including 8580 patient samples.
(2) ShRNA data were downloaded from The Project Achilles database, which provides shRNA depletion scores from pooled genomic library tests across 216 cancer cell lines.
(3) High-throughput CRISPR-Cas9 screening data, including 63 cancer cell lines, were downloaded from the GenomeCRISPR database.
(4) A genome-scale genetic interaction map in yeast was obtained from Costanzo et al. (Costanzo M, Baryshnikova A, Bellay J et al. The genetic landscape of a cell. Science 2010; 327: 425-31.).
(5) The original pharmacological screening data were downloaded from Cancer Cell Line Encyclopedia (CCLE), Genomics of Drug Sensitivity in Cancer (GDSC), Broad Cancer Therapeutics Response Portal (CTRP, http://www.broadinstitute.org/ctrp/) and NCI60.
(6) Synthetic viable or synthetic lethal interactions were integrated from 17 studies (Table 1)
Table 1. Statistics of the SV and SL interactions from other studies
| Source (PMID) | SL | SV |
|---|---|---|
| 27438146 | 107 | |
| 26427375 | 843 | |
| 27453043 | 5065 | |
| 24025726 | 98 | |
| 23728082 | 100 | |
| 26516187 | 19952 | |
| 24104479 | 200 | |
| 26227665 | 23 | 40 |
| 28319113 | 168 | 10 |
| 26451775 | 1309 | |
| Boettcher et al. | 57 | 80 |
| 28481362 | 95 | 178 |
| 26781748 | 846 | |
| 27557495 | 464 | |
| 23563794 | 211 | 199 |
| 28319085 | 30 |
3.1 Search


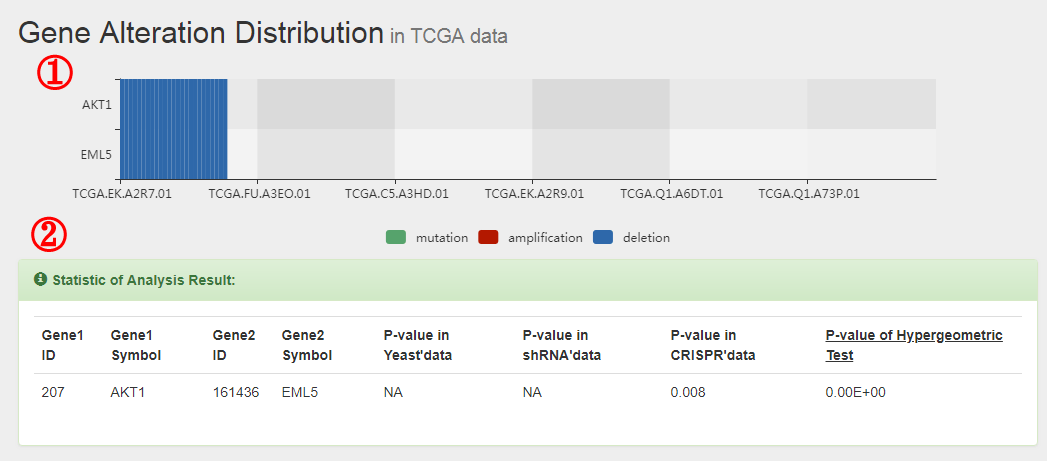
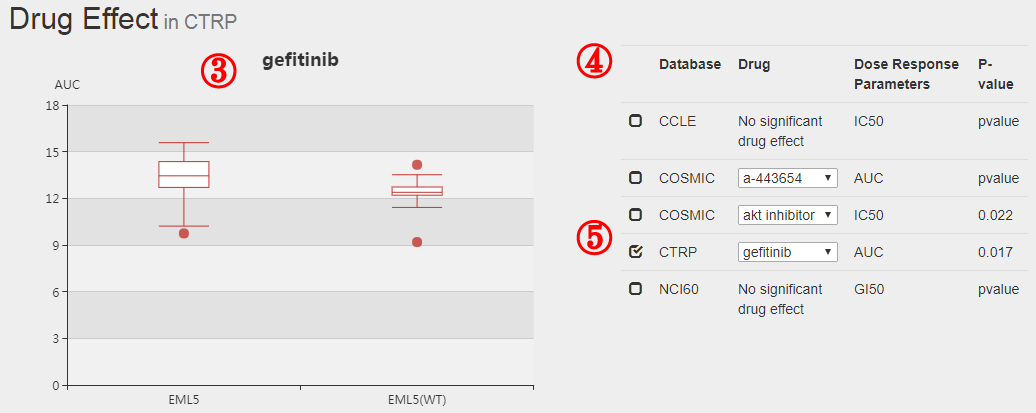
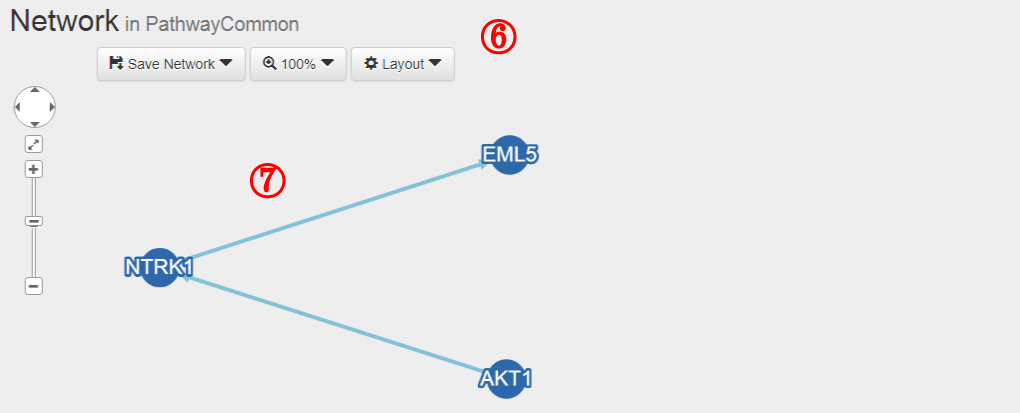

The formula to combine the individual scores as follows:

Table 2. Quantitative scores assigned to SVs and SLs according to the experimental methods annotated in evidence sources
| Method | Score |
|---|---|
| Mutant & Mutant | 0.9 |
| CRISPR | 0.9 |
| Low-throughput | 0.8 |
| RNA interference & Mutant | 0.75 |
| Bi-specifie RNA interference | 0.5 |
| RNA interference & Drug inhibition | 0.5 |
| High-throughput | 0.5 |
